Tracking Fireworks Impact on Fourth of July AQI
I’m increasingly of the opinion that fireworks should not be used at all, or at best sparingly in the best conditions for safe dispersal of the pollutants. There are fire risks, limb risks, and breathing risks that come with exploding toxic chemicals in the air. However, America disagrees with me, especially at 8:45 PM local time on July 4th each year.
I learned about PurpleAir after spending a few years in California and having to adjust my life when wildfire smoke was around. The US Government’s Air Quality map usually lags what you can see in the air. Often times I’d open it when it was dreadfully obvious that it was a 150-200 PM2.5 AQI day, and it was still reporting under 100. Only after multiple days of requiring a N95 and clothes smelling like a campfire would it be updated. Fortunately, many people have adjusted by buying PurpleAir monitors and you can see live-to-the-minute information about the air quality around you on the PurpleAir map.
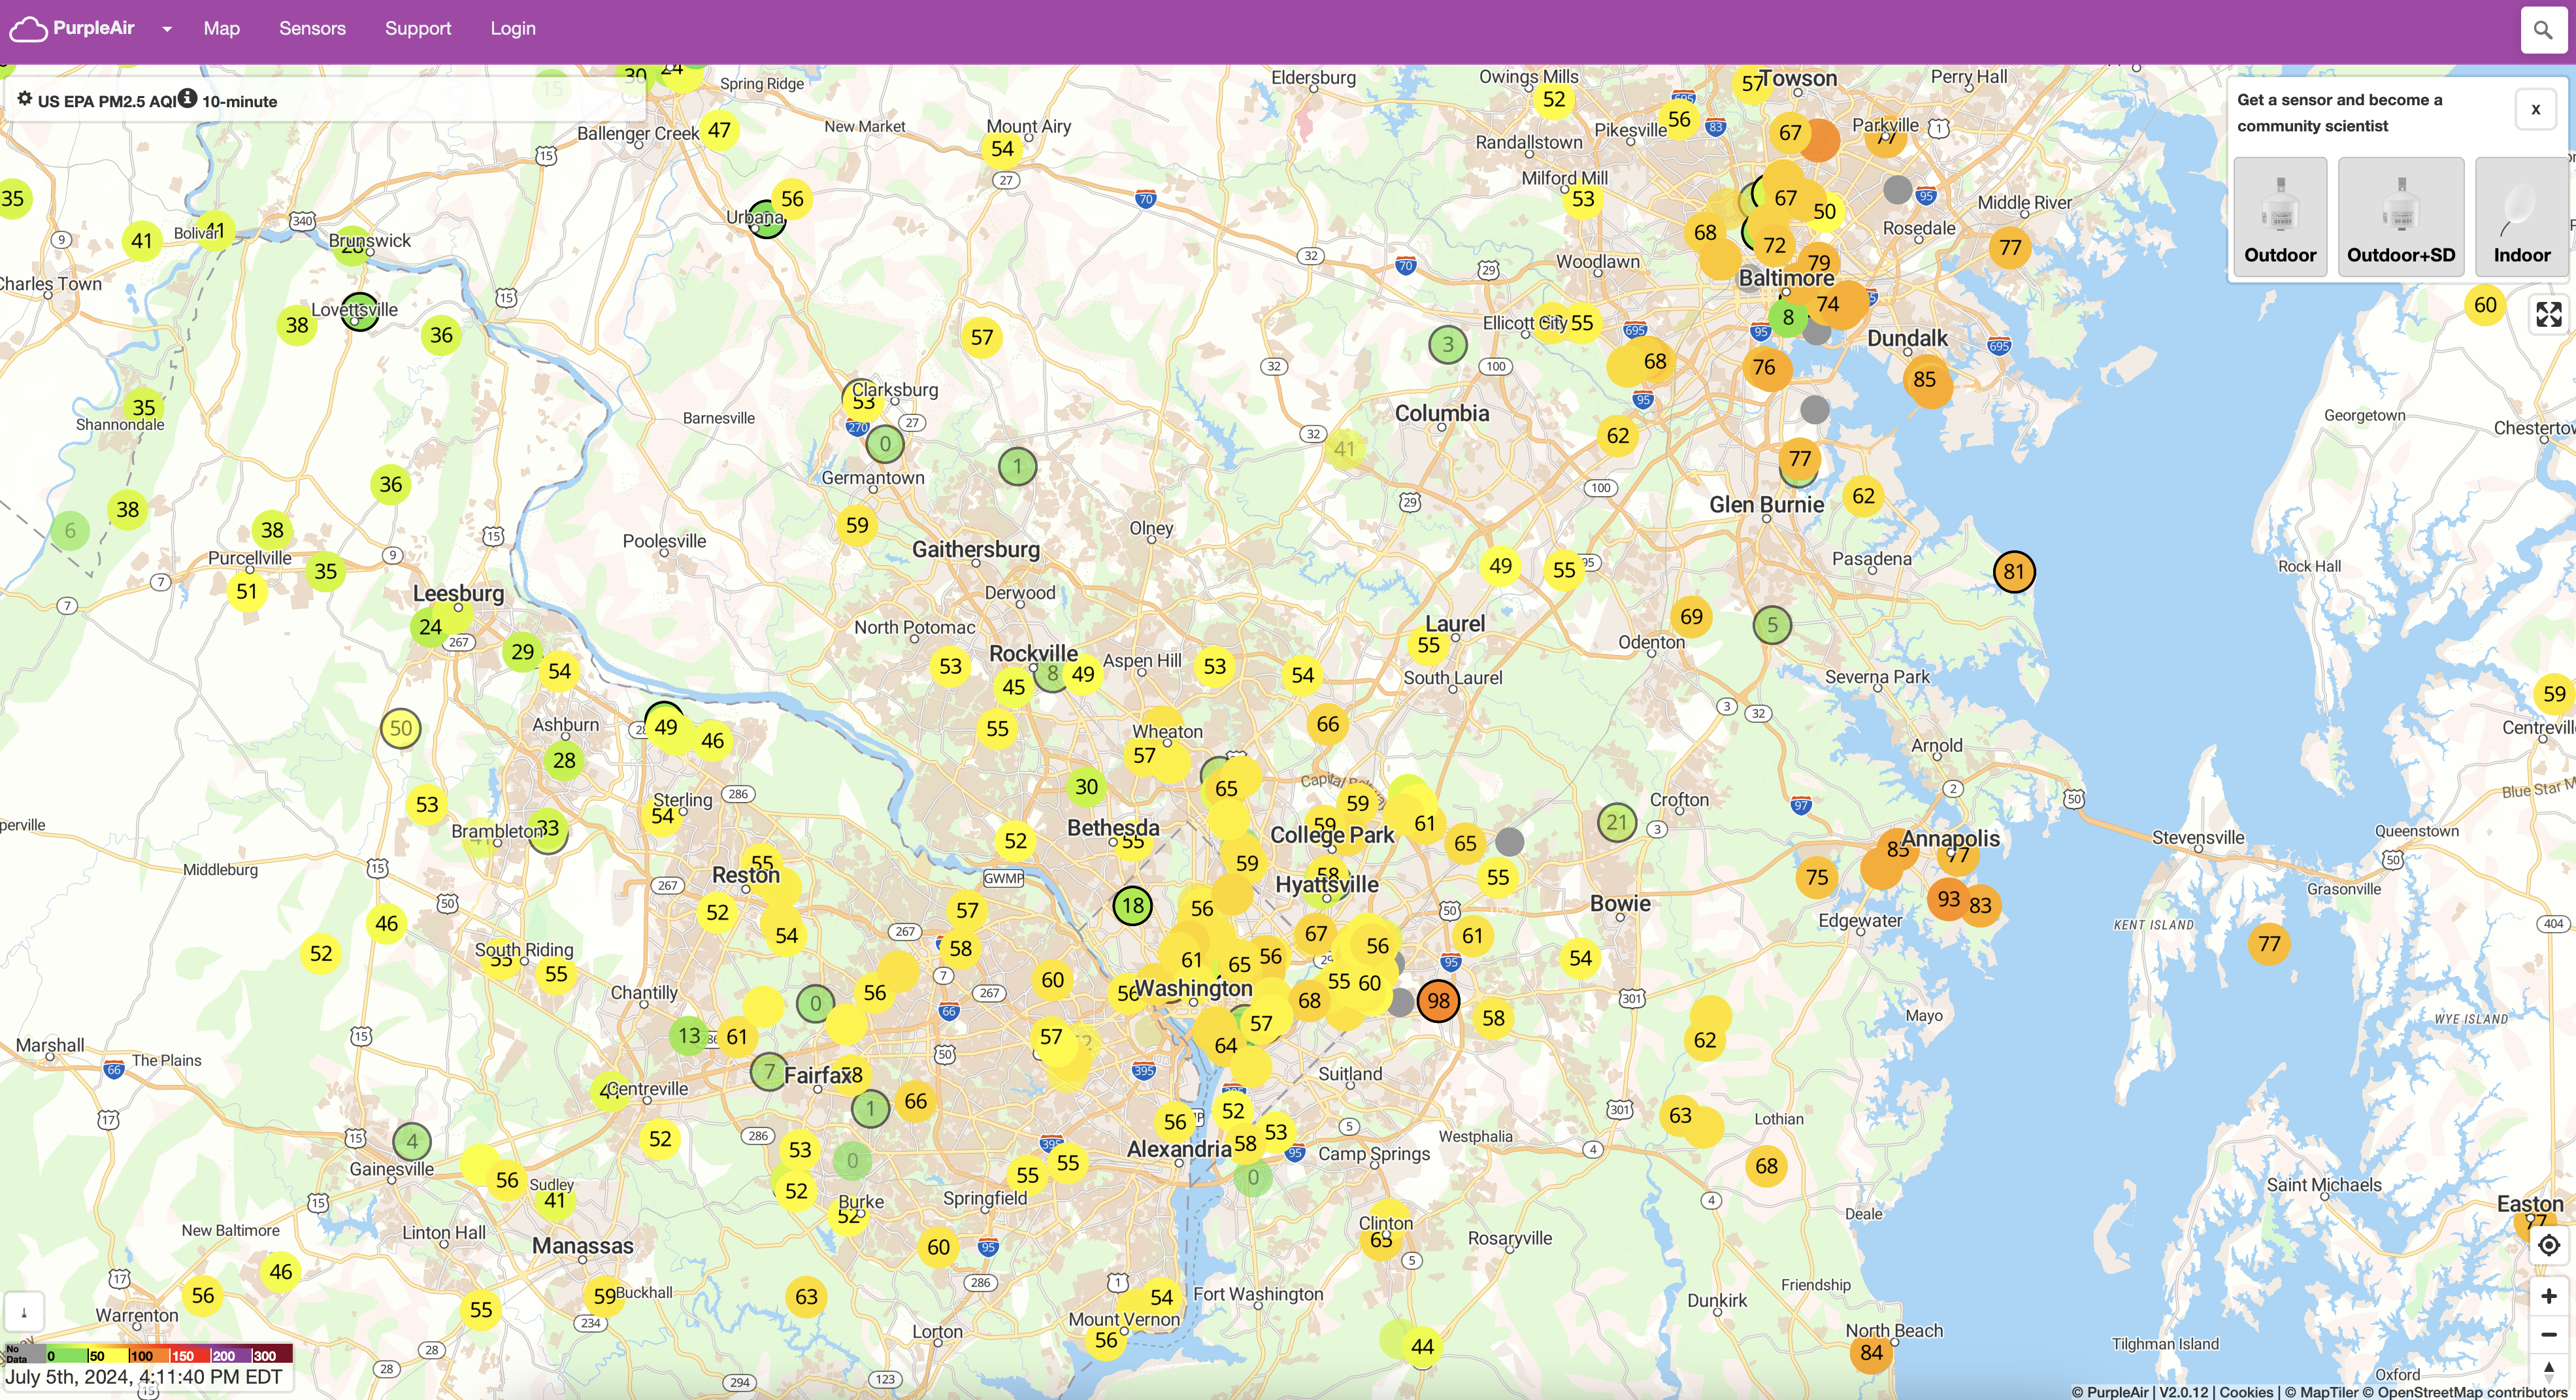
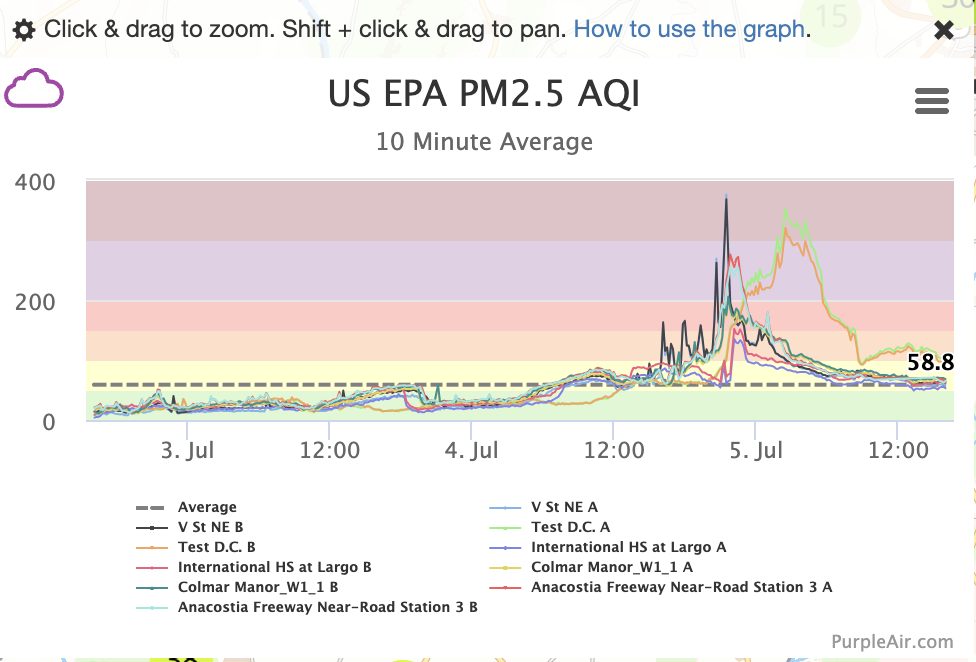
Armed with this massive and real-time map, you can see the effects of fireworks can be acutely and suddenly be seen on the national scale. I remembered to check this site after hearing fireworks in the DC area. You can quite clearly see various monitors noting massive rises in the AQI metric in the evening of July 4th.
Having missed my chance for watching this unfold in DC, I turned my attention to the San Francisco Bay Area. I setup Shot-Scraper, a Python command line library, that opens a headless browser, waits a few second, and then takes a screenshot. I installed the library in its own virtual environment, created a folder for the images, and fired off a few test screenshots to make sure it looked good.
$ mkdir purpleair && cd purpleair
$ python3 -m venv venv
$ source venv/bin/activate
$ pip install shot-scraper
$ mkdir images
$ shot-scraper https://map.purpleair.com/1/mAQI/a10/p604800/cC0#8.45/37.764/-121.62 --wait 5000 -o ~/Projects/images/bay-area-$(date +%Y%m%d_%H%M%S).png`
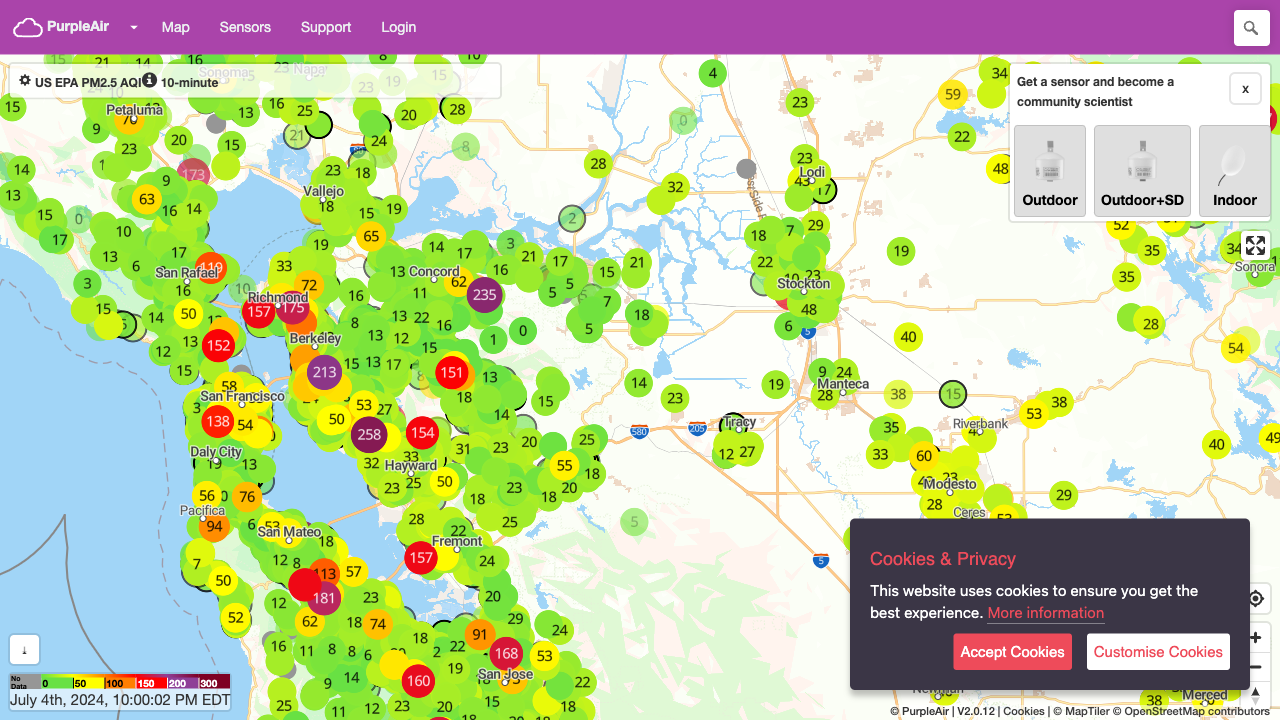
Here’s what I eventually landed on. The first shot was at 10 PM EDT, or 7 PM local. You could see there were a few hot spots already; unclear if those were fireworks related.
Once I had it creating screenshots via the command line, I needed a script to activate the Python environment and trigger the command.
#!/bin/bash
cd ~/Projects/purpleair
source venv/bin/activate

shot-scraper https://map.purpleair.com/1/mAQI/a10/p604800/cC0#8.45/37.764/-121.62 --wait 5000 -o /Users/dpage/Projects/purpleair/images/bay-area-$(date +%Y%m%d_%H%M%S).png
Using the $ crontab -e command, I added an entry to fire off that script every minute.
*/1 * * * * ~/Projects/purpleair/scraper.sh
And then I let it run overnight. After 12 hours of running, I had plenty to work with. Using ffmpeg, I could then combine the images into a 30 second video.
$ ffmpeg
	-f image2
	-pattern_type glob
	-export_path_metadata 1
	-i '*'
	-vf "drawtext=text='%{metadata\:lavf.image2dec.source_basename\:NA}'"
	-r 30 -c:v libx264 -b:v 1M -vf scale=640:-1
	../output.mp4
Twitter is very particular about what video format it accepts, you may need to fight with the conversion
Finally, here is that video! This runs from 7 PM to 7 AM in the San Francisco Bay Area as well as the Central Valley.
Good morning Bay Area, you're dealing with elevated AQI at a wildfire equivolent because of fireworks. Here's the timelapse from 7 PM to 7 AM via @ThePurpleAir map & @simonw's shot-scraper library.
— Danny Page 🧮 (@DannyPage) July 5, 2024
Modesto went even higher, but the Bay traps the bad air until the morning. pic.twitter.com/hxRm1CpztP
You can instantly see the impact of the fireworks. 200+ plus is dangerous for anyone if exposed to it for sustained amount of time. 100+ can hit sensitive groups hard. And given the nature of the Bay Area and the Oakland/Fremont hills, the toxic air can hang around. It’s dreadful during wildfire season and makes it all the more questionable that we would do this to ourselves.